


Introduction to Level 3 by Tony Eng
Video Transcript: Whenever I listen to a talk about research that’s similar to mine I sit there and I think is what they’re doing different? or – what are they doing instead? And, this is the problem that you’re going to address this week in the assignment you need to think about how your research differs from things that are already out there.But, the difficult part is trying to figure out how to put that into a visual representation that highlights the key differences. Check out the assignment for more instructions and some examples. Get ready to roll up your sleeves.
Directions
Technical audiences, particularly those in the same or a similar field, will often wonder how your work differs from other related work in your problem area. It is important for you yourself to know this, to be able to differentiate your work from others and to be able to show where you approach fits into the grand scheme of things. A visual will allow you to do this quickly and more efficiently than words alone.
For this assignment, create a single visual in which you show how your approach differs from other approaches. It should be a “synthesis of previous work” into a single visual with a caption explaining what it is you want your reader to see.
Complete The Following Steps
- Review the Rubric provided below.
- On a scrap piece of paper make notes on all of the information needed to be conveyed in the graphic.
- On a piece of paper, in a powerpoint slide, or in a program make your graphic for the assignment.
- Software* you can use to make this:
- Powerpoint
- Gliffy Diagrams (In-browser chrome application – works well for chromebook)
- Google Slides
- Adobe Illustrator (Advanced)
- Software* you can use to make this:
- Find 2-3 friends or colleagues and gather feedback from them using the peer feedback instructions below.
Notes
The difficult part of this assignment is figuring out the best way to synthesize the various approaches together into a meaningful and clear visual.
Rubric

Peer Feedback Instructions
Find 2-3 people and show them your visual. Ask them the following questions:
Regarding the visual:
- Was it clear how the presenters research approach/work differs from others?
Regarding the design:
- Was the visual stand-alone & self-explanatory?
- Was the visual easy to read and understand?
- Was the audience’s gaze drawn to the most important part of the visual?
Overall:
- Does the audience have any additional constructive and specific feedback for improvement?
Model (s)
Finished Model 1
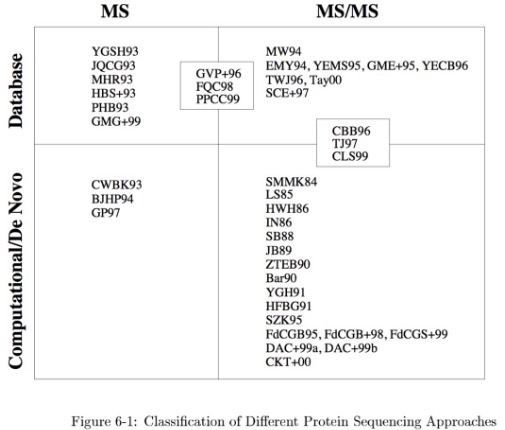
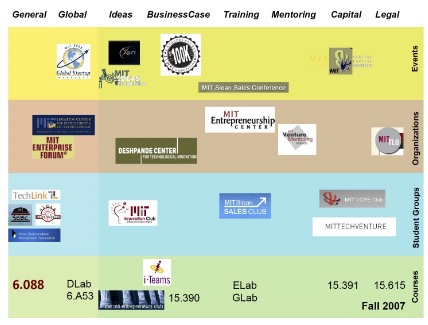
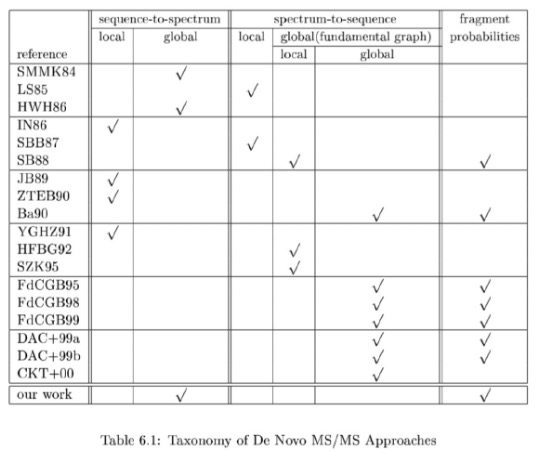
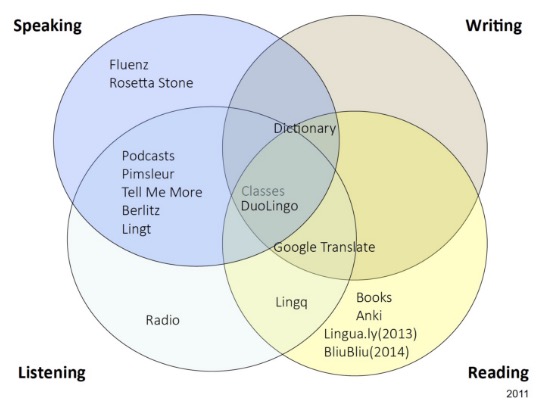
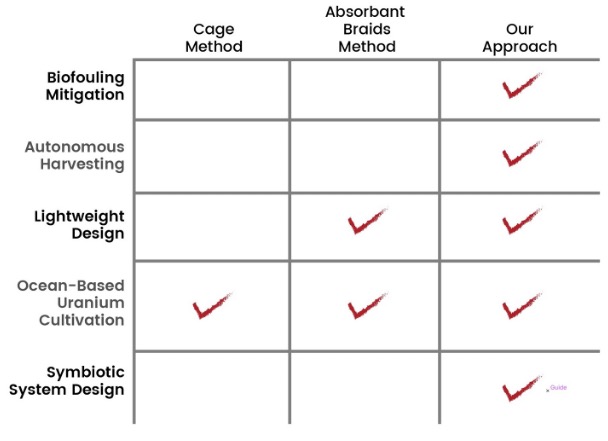
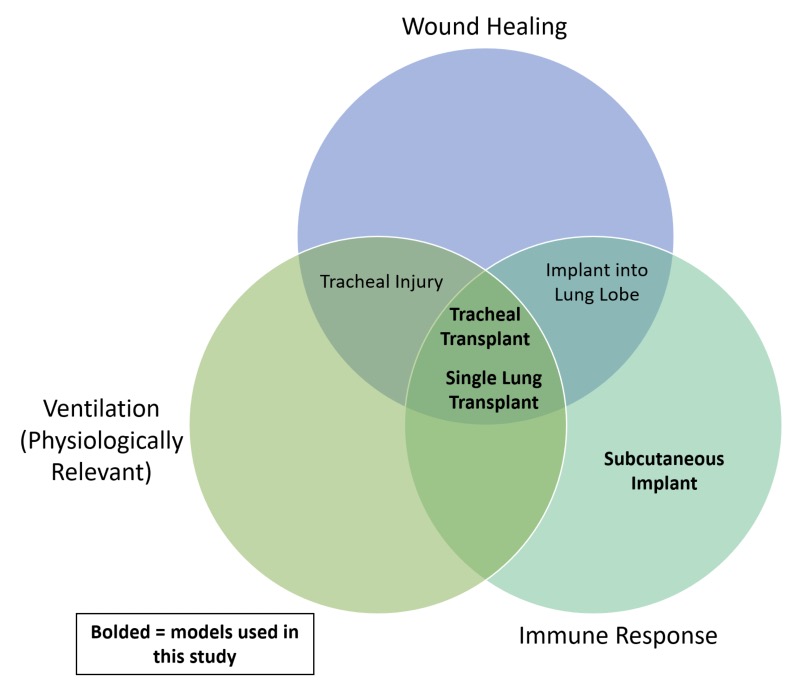
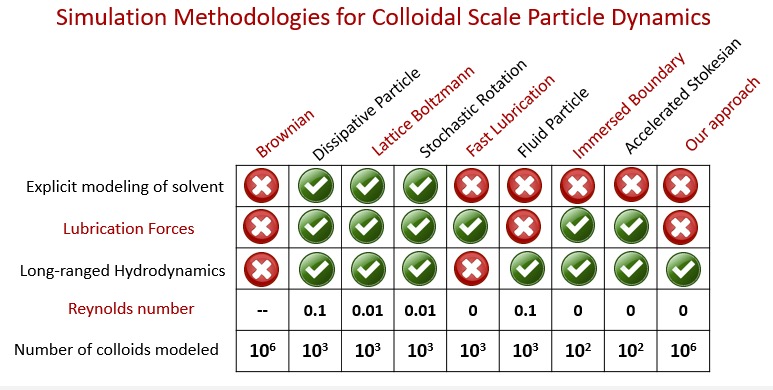
“A table of approaches and features with check marks whenever an approach has a particular feature; a graph with the approaches plotted against features that serve as the dimensions or axes of the graph; a diagram of a system or process and how the different approaches affect different parts of the system/process; or something else that might be more appropriate.”
Finished Model 2
Finished Model 3
Finished Model 4
Finished Model 5
Finished Model 6
Finished Model 7
Finished Model 8
Case Study: Maha Haji On Giving Context When Discussing Previous Work
WARNING: This video serves as a demonstration of the underlying ideas from this exercise applied to a (then) current MIT graduate student. The video is a little long. While it isn’t necessary to watch this video in order to progress through the next level, it is encouraged.